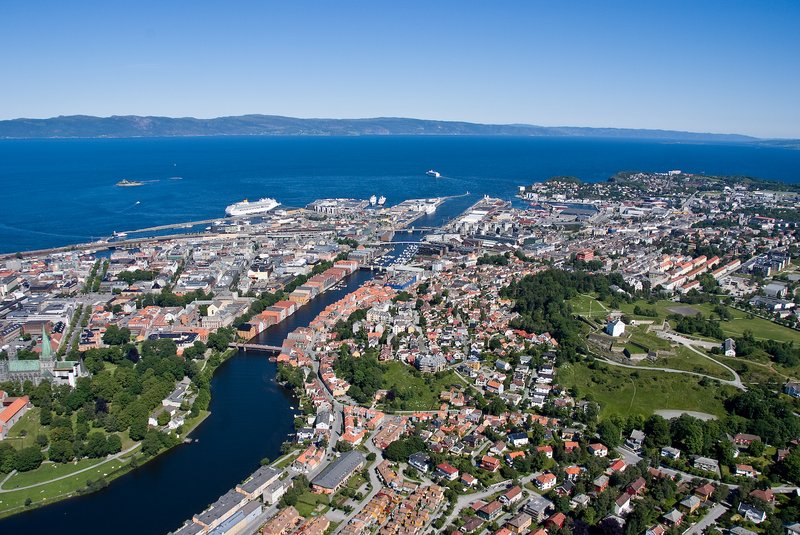
Trondheim, Trøndelag, Norway
Norway's historic capital and home to Nidaros Cathedral, a vibrant student city with cutting-edge technology.
Overview
Trondheim is a city in Trøndelag with a population of 205,000. Norway’s historic capital and home to Nidaros Cathedral, a vibrant student city with cutting-edge technology. Housing costs are close to the national average. The overall cost of living is above the national average. Gardening thrives here — the 5a growing zone supports Cool — many vegetables, some fruit trees. Reported crime rates are relatively low.
Last updated: August 30, 2026
Above Average vs Norway Avg (100)
Above Average
Household income
Job market health
Trondheim vs Norway Average
Taxes
- Income Tax: None
- VAT: 25.0%
Economy & Jobs
- Median Income: NOK 460,000
- Unemployment: 3.2%
- Population: 205,000
Climate
- Sunny Days: 160/year
- Summer High: 66°F
- Winter Low: 24°F
- Farming Zone: USDA Zone 5a
Housing
- Median Home: kr4,500,000
- 1BR Rent: kr12000/mo
Cost of Living
Trondheim's cost of living index is 118 (Norway average = 100).
| Category | Trondheim | National Average | Difference |
|---|---|---|---|
| Overall | 118 | 100 | +18.0% |
| Housing | 125 | 100 | +25.0% |
Data source: SSB / Numbeo, 2026
Housing Market
| Metric | Value |
|---|---|
| Median Home Price | kr4,500,000 |
| Median Rent (1BR) | kr12000/mo |
| Median Rent (2BR) | kr15,000/mo |
| Price per Sq Ft | kr3,000 |
Data source: Finn / Numbeo, 2026
True Cost of Home Ownership
Utilities
Estimated monthly utility costs for a typical household in Trondheim:
| Utility | Estimated Monthly Cost | Notes |
|---|---|---|
| Electricity | kr1500 | |
| Heating & Cooling | kr194 | Estimated based on local climate. |
| Cooling (AC) | N/A | Estimated based on local climate and electricity rates |
| Water | kr500 | Includes sewer |
| Internet (100+ Mbps) | kr600 | Broadband average |
| Garbage / Trash | Included in taxes | Municipal service (covered by property taxes) |
| Total Utilities | kr2794 | Monthly estimate (including heating & cooling) |
Data sources: NVE, Statnett, Telenor 2025
Remote Work Score
Trondheim scores —/100 for remote work readiness:
Climate
Trondheim has a varied climate with distinct seasons.
| Month | Avg High | Avg Low | Rainfall |
|---|---|---|---|
| January | 44°F | 24°F | 2.5" |
| April | 51°F | 39°F | 2.8" |
| July | 66°F | 41°F | 1.5" |
| October | 46°F | 42°F | 2.2" |
Cool — many vegetables, some fruit trees
Natural Hazards
Trondheim faces the following natural hazards:
Norway experiences severe winter storms.
Mountainous region with frequent avalanches.
River and coastal flooding.
Mountainous region with landslides.
Based on historical records and geographic risk assessment.
Taxes
- Income Tax: 0% (None)
- VAT: 25%
- Property Tax: ~0.3% of assessed value
Economy & Jobs
Major industries include technology, healthcare, education, and manufacturing. The unemployment rate is 3.2%.
Crime & Safety
Crime rates in Trondheim per 100,000 residents:
City-level crime data is not available for this location. The figure shown is the national average, which may differ significantly from actual conditions in this city.
Data source: Eurostat
Schools & Education
Academic Schedule
Høstferie (autumn break) in October (1 week).
Demographics
The population of Trondheim is diverse. The figures below show the ethnic, educational, and religious composition of the local population.
Ethnicity
Education
Religion
City-level demographic data is not available for this location. The figures shown are national averages, which may differ from actual conditions in this city.
Data source: Statistics Norway (2022)
Important Disclaimer: All data on this page is for informational purposes only and does not constitute financial, legal, tax, or real estate advice. URCity and Northshore Press are not financial advisors, tax professionals, or real estate agents. Always consult qualified professionals before making relocation or financial decisions.
Frequently Asked Questions
What is the cost of living in Trondheim, Trøndelag, Norway?
The cost of living index in Trondheim is 118, which is Higher the Norway national average of 100.
How much does it cost to buy a home in Trondheim?
The median home price in Trondheim is kr4,500,000. The housing index is 125.
What is the average rent for a 1-bedroom apartment?
The average rent for a 1-bedroom apartment in Trondheim is approximately kr12000/mo.
Does Trondheim, Trøndelag have income tax?
Trondheim is in Trøndelag, which has no income tax.
What is the climate like in Trondheim?
Trondheim enjoys approximately 160 sunny days per year. Summer highs reach around 66°F, while winter lows can drop to around 24°F.
Data Sources
- Cost of Living: SSB / Numbeo, 2026
- Housing Data: Finn / Numbeo, 2026
- Income & Employment: SSB Labour Force Survey, 2024
- Utilities NVE, Statnett, Telenor 2025
Data last updated: September 13, 2026. Data may not reflect current market conditions. Always verify with local sources before making relocation decisions.